Geology 319 Structural Geology: The Architecture of Earth’s Continental Crust
Lab Unit 3
The Stereonet: A Three-Dimensional Graphical Calculator
Overview
The stereonet is a very handy tool in structural geology. It offers a convenient way to represent planes and lines, to analyze data, and to perform three-dimensional calculations. In Lesson 1 you will learn the theory behind the stereonet; Lesson 2 covers how to set up your stereonet; in Lesson 3, you will learn the techniques for plotting lines and planes; and in Lesson 4 you will learn how to use the stereonet to summarize geological data.
Both of your textbooks have good discussions of this topic, so readings will be an important part of this lab unit. In addition to readings, this unit will present you with a method to help visualize the three-dimensional relationships that you will be learning to plot. You will also have the opportunity to practice your new skills with practice exercises at the end of the unit.
Objectives
After working through this lab unit, you should be able to use the stereonet to
- plot planar geological structures.
- plot poles to planar geological structures.
- plot linear geological structures.
- calculate the orientation of a line formed by the intersection of two planes.
- plot and measure strike, dip, plunge, trend, and pitch (rake).
Materials
- Basic Methods of Structural Geology by Marshak & Mitra
- several sheets of 8½″ × 11″ tracing paper or vellum
- sharp pencil
- eraser
- a thumbtack
- a sturdy piece of cardboard (e.g., cardboard scavenged from the cover of an old binder—you can get by with Bristol board or the side of a cereal box)
- tape
- optional: three CDs (that no one will miss), bowl, marker, utility knife, cutting board, safety glasses
Lesson 1: The Conceptual Foundation of Stereographic Projection
Reading Assignment
- Read Davis, Reynolds, & Kluth: “I. Carrying out Stereographic Projection” to the end of “Stereographic Net, or Stereonet” (pp. 735-715)
- Read Marshak & Mitra: “5-1. Introduction,” “5-2. Concept of a Stereographic Projection,” and “5-3. The Stereonet” (pp. 87-95)
Your goal for these readings is to learn the following:
- Why does the stereonet represent three-dimensional information?
- What do the grid lines on the stereonet represent?
- What are great circles?
- In structural geology, we use a lower-hemisphere, equatorial, equal-area net. What do these characteristics represent, and how are they used?
Lesson 2: How to Prepare Your Stereonet
Detach the equal-area (Schmidt) net from Marshak & Mitra (p. 411), and mount it on a sturdy piece of cardboard using tape or glue. Alternatively, you could laminate page 411 (many office supply stores can do this for you quickly and inexpensively). The purpose of mounting or laminating the stereonet is to make it more durable.
After you have reinforced your stereonet, push a thumbtack through the backing at the centre of the stereonet (i.e., so that the pin comes out the front, through the centre of the stereonet). Secure the thumbtack from the back with a piece of tape. When you are not using your stereonet, stick a piece of eraser onto the pin to help protect against possible injury.
When you begin to use your stereonet, you will do your plotting on an overlay, not on the stereonet itself. This is necessary because you will need to rotate your plot with respect to the stereonet. The best material to use for this is tracing paper or vellum, because it is easy to see the net through the paper. Do not use lined paper.
Place the tracing paper/vellum on the stereonet so that the pin sticks through it (see Fig. I.4, Davis, Reynolds, & Kluth, p. 739). Before you apply the tracing paper, you may wish to stick a piece of tape on the back of the overlay where the pin will go, to keep it from tearing around the pin hole. Trace the primitive circle onto the overlay, and mark the positions of N, S, E, and W. Now you're ready to go.
Visualization Tool
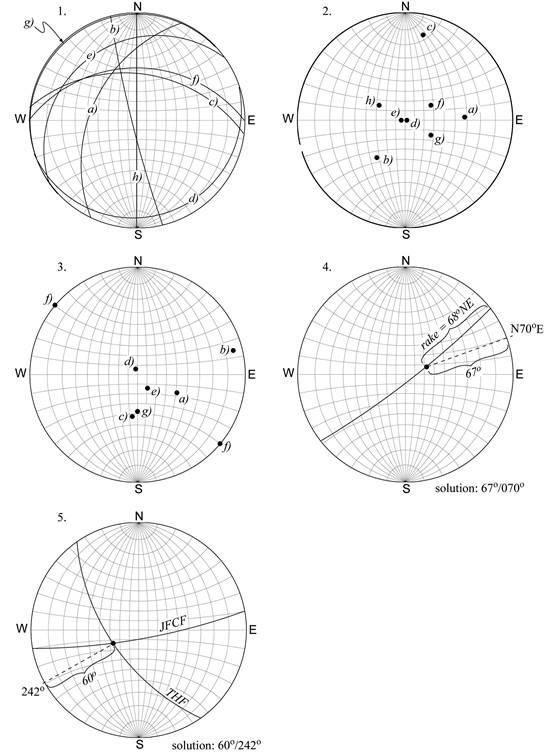
On page 90, Marshak and Mitra use a cereal bowl analogy (Fig. 5-5) to help you visualize the planes and lineations that you will plot on the stereonet. Here, we will take this analogy a little further. Pictures of a similar model will be included throughout the unit. You can make your own model using old CDs and a bowl. Prepare the bowl by marking off N, S, E, and W (Fig. 3.1, below).
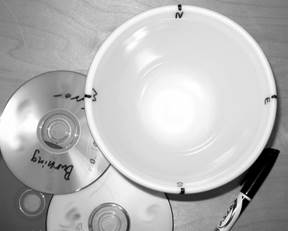
Figure 3.1. Materials for visualizing the three-dimensional world captured by a stereonet
Lesson 3: Basic Plotting Procedures Using the Stereonet
Marshak and Mitra provide detailed instructions for using your stereonet. For each of the processes in this section, follow the directions on the pages indicated. Use a new overlay each time, and label the data you plot as shown in the examples. If you have difficulty, spend some time with the visualizations. Test how well you've understood the process by doing the practice exercises at the end of the unit and checking your answers using the answer key provided.
Plotting a Plane
Reading Assignment
- Read Marshak & Mitra: “Plotting a Plane” (pp. 95-96)
In Figure 3.2 (below), the bowl represents the three-dimensional space of the lower hemisphere of the stereonet. The view of the bowl from directly above is analogous to the two-dimensional view you see when looking at the stereonet. In these demonstrations, the CDs represent planes.
Plot the plane 000°/90°:
Place the CD in the bowl so that it is oriented along 000° (i.e., North-South; Fig. 3.2a). Hold the CD vertically, so that it dips at 90°. Trace along the lower edge of the CD, then remove it from the bowl. Notice that vertical lines appear straight when plotted on the stereonet (Fig. 3.2b).
Plot the plane 000°/0°:
Draw a strike line on the CD. The strike line should pass through the centre of the CD (Fig. 3.2c). Place the CD in the bowl so that the strike line is oriented along 000° and the CD itself is laying flat (i.e., dipping at 0°). Trace around the edge of the CD; then remove it from the bowl. Horizontal planes appear as circles around the outermost great circle of the stereonet (Fig. 3.2d). Notice that you would get the same result regardless of which way the strike line on your CD was oriented. This is why it is not meaningful to specify a strike for a horizontal plane.
Plot the plane 000°/45°E:
Once again, place the CD in the bowl so that the strike line is oriented along 000°. Next, tilt the CD so that it dips at approximately 45° (halfway between horizontal and vertical) and so that the downhill direction is to the east (Fig. 3.2e). Trace around the lower edge of the CD; then remove it from the bowl. Dipping planes appear as curved lines on the stereonet. In Fig. 3.2f, the curved line appears to be closer to the plot of the horizontal plane than the plot of the vertical plane. This is because the bowl used for the demonstration is not perfectly spherical. If you were to draw the plane 000°/45°E on your stereonet, you would find that it is always an equal distance from the planes 000°/90° and 000°/0°. This makes sense, because 45° is half of 90°.
1. Plot the plane 000°/90°
2. Plot the plane 000°/0°
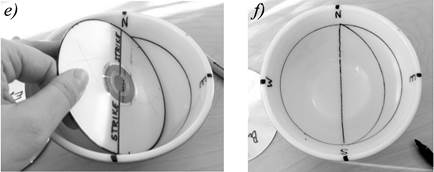
3. Plot the plane 000°/45°E
Figure 3.2. Plotting planes
Plotting a Line
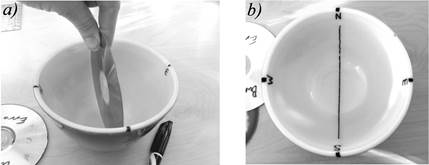
Describing the orientation of lines: Plunge and trend (or bearing) are to a line what strike and dip are to a plane. In other words, the trend of a line (or lineation) is the geographic direction in which the line is oriented. The plunge refers to the angle (down) from the horizontal at which the line is tilted (in Fig. 3.3a, the pen symbolizes a line).
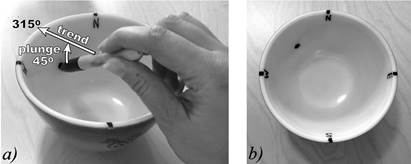
Plot the line 315°/45°. Lines appear as dots on the stereonet.
Figure 3.3. Plotting a line
There is an important difference between strike and trend, however. Strike is always oriented perpendicular to dip, and can be reported in either of two directions (e.g., a strike of 090° is the same as a strike of 270°). In contrast, the trend of a line is always oriented in the plunge direction. In Figure 3.3a, the line tilts downward along a trend of 315°. If you were to report the trend as (315° - 180°) = 135°, you would be indicating that the line was tilting downward to the southeast instead of the northwest. Because the trend tells you the direction in which the line is plunging, it is not necessary to report the direction of the plunge. Contrast this with dip, where it is necessary to report the dip direction because there are two possible dip directions for one strike. For example, if you reported the orientation of the line in Figure 3.3. as 315°/45°, your meaning would be clear, but if you reported the orientation of a plane as 315°/45°, it would be unclear whether the plane was dipping SW or NE. Note that the orientation of a line is more commonly written in the order plunge/trend, or 45°/315°.
Reading Assignment
- Read Marshak & Mitra: “Plotting a Line” (p. 96)
Lines appear as dots on the stereonet (see Fig. 3.3b). Note that horizontal lines are plotted as two points: one in the trend direction, and the other in the opposite direction.
Plotting a Line on a Plane
Sometimes it simplifies matters to describe a line as it appears in a particular plane of interest. For example, if you are drawing lines for a geometry problem (on a horizontal surface), you may be interested in the angles between those lines, but you probably would not need to take the orientation (horizontal vs. vertical) of the paper into account—if you hold the page up vertically, the angles between the lines will remain the same, even though the orientation of your page has changed.
The rake or pitch of a line is the orientation of that line measured within a particular plane (Figs. 3.4 & 3.5). (Note: Davis, Reynolds, & Kluth, Fig. I.10, p. 743 may help you remember the meanings of the terms rake, pitch, and plunge. You may wish to add your own labels for strike and dip.)
Reading Assignment
- Read Marshak & Mitra: “Plotting a Line on a Plane” (pp. 96-97 and Fig. 5-14, p. 98)
Note that the point is not apparent in Figure 5-14. Draw in the point where the arrow labelled 34° contacts the plane (Fig. 5-14d, e).
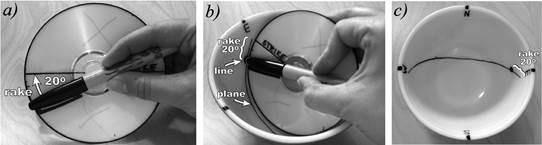
a) Pen tilts 20° down from the horizontal in the plane represented by the CD.
b) The rake of the line is 20°E in the plane oriented 090°/70°N.
c) On the stereonet, a line in a plane appears as a point on the plane.
Figure 3.4. Rake, line, and plane
Reading Assignment
- Read Marshak & Mitra: “Determination of the Rake of a Line” (pp. 97-98 and Fig. 5-15, p. 99)
- Read Marshak & Mitra: “Determination of Plunge and Bearing from Rake” (pp. 98-99)
- Read Marshak & Mitra: “Determining the Intersection of Two Planes (pp. 101-102 and Fig. 5-20, p. 103)
Your goal for these readings is to learn how to do the following:
- Determine the rake (pitch) of a line.
- Determine plunge and bearing (trend) from rake.
- Find the intersection of two planes.
You can simulate intersecting planes using CDs by cutting a slit on one side of each of two CDs and fitting the CDs together (Fig. 3.5a).
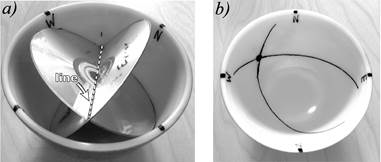
a) Visualize the pole intersecting the plane at a right angle.
b) The pole is the point where the pen touched the bowl.
Figure 3.5. Intersecting planes
Reading Assignment
- Marshak & Mitra: “6-2. Pole to a Plane” and “Method of Plotting a Pole” (pp. 105-106)
Plot the pole to a plane: The pen in Figure 3.6a is analogous to a pole. The pen intersects the CD at 90°. In Figure 3.6b, the pole is plotted at the point where the pen touched the bowl. Note that the angular distance between the plane and the pole in view b is 90°.
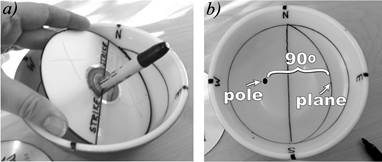
a) Visualize the pole intersecting the plane at a right angle.
b) The pole is the point where the pen touched the bowl.
Figure 3.6. Plotting a pole
Measuring the Orientations of Planes and Lines from the Stereonet
It is possible to measure the orientation of a plane and a line (lineation) from a stereonet plot made by someone else merely by reversing the procedures used to plot them. Try this several times by following the steps below, using some of the examples in Marshak and Mitra.
For a Plane
- Orient the diagram in the “home” position.
- Read the strike from the intersection of the stereographic plot with the primitive circle.
- Rotate the diagram until the stereographic plot lies on a great circle on the stereonet, and then read its dip down from the primitive circle.
For a Line
- Rotate the diagram until the point lies on either the N-S or E-W line on the stereonet.
- Put a tick mark on the primitive circle.
- Read the plunge down from the primitive circle.
- Rotate the diagram to the “home” position so that you can read the trend.
Practice Exercises
Solutions to the following practice exercises are included at the end of this lab. You may wish to try some of these exercises now to be sure you understand the plotting procedures before you move on to the lab (credit) assignment. You may also wish to do some of these exercises as practice for the final exam.
- Exercise 1 (Marshak & Mitra, pp. 102-103)
- Exercise 2 (Marshak & Mitra, p. 103)
- Exercise 1 (Marshak & Mitra, p. 124)
- Exercise 4 (Marshak & Mitra, p. 103)
- Two faults cut a series of interbedded sandstones and volcanic rocks, and gold-bearing quartz veins occur at the intersection of the two faults. The Timber Hills Fault has a strike and dip of 145°/60°W; Joan's Folly Creek Fault has a strike and dip of 080°/80°S. As part of a gold exploration program, you have been hired to figure out where to drill exploration holes. What is the plunge and trend of the zone likely to contain gold?
Lesson 4: Introduction to Clustering: The Semi-statistical Use of the Equal-Area Net
The stereonet is a very useful tool for viewing a set of geological observations. It permits users to see at a glance whether there is any pattern in the orientation of structures that have been plotted. It is possible to analyze a data set plotted as planes, but often it is much easier to analyze a plot of the poles to those planes. You will see an example of this in a later lab.
The analysis of a set of points on the stereonet proceeds by drawing contours. Contours are lines that subdivide the plotted points into regions of differing density. In this case, density refers to the number of points in a particular space. A space with more points would have a higher density than the same space with fewer points.
Reading Assignment
- Read Davis, Reynolds, & Kluth: “Stereographic Projection as a Statistical Tool” and “Evaluating Preferred Orientations” (pp. 747-751)
- Read Marshak & Mitra: “8-1. Introduction” (pp. 145-146)
- Read Marshak & Mitra: “8-3. Contouring of Equal-Area plots” (pp. 148-150 only)
- Read Marshak & Mitra: “8-4. Patterns of Point Data on Equal-Area Projections” (pp. 155-157)
Your goal for these readings is to learn the following:
- In general terms, what is the approach for a quantitative analysis of the distribution of points on the stereonet?
- What do contours look like?
- What happens to a contour line that hits the primitive circle? (e.g., Fig. I.18E, Davis, Reynolds, & Kluth, p. 750) Draw a sketch for your notes.
- What do the terms point-diagram (or scatter diagram), contoured diagram, preferred orientation, and synoptic diagram mean?
- Certain types of patterns occur frequently in structural data plotted on stereonets. These patterns may be observed in point diagrams or contoured diagrams. Sketch an example of each of the following for your notes: uniform distribution, point-maximum, great-circle girdle, small-circle girdle.
Assignment 3
You should now complete the lab portion of Assignment 3, which you can find in the assignment drop box. Assignment 3 is worth 6% of your final grade (theory portion: 2.5%; lab portion: 3.5%).
After you have completed Assignment 3, please submit this assignment (both theory and lab portions) to your tutor for grading. Please submit your assignment via the appropriate assignment drop box at your online course site. If you are unable to use the assignment drop box, please contact your tutor for an alternative submission method.
Solutions to Practice Exercises